GOVERNMENT-CERTIFIED COURSE
50% OFF
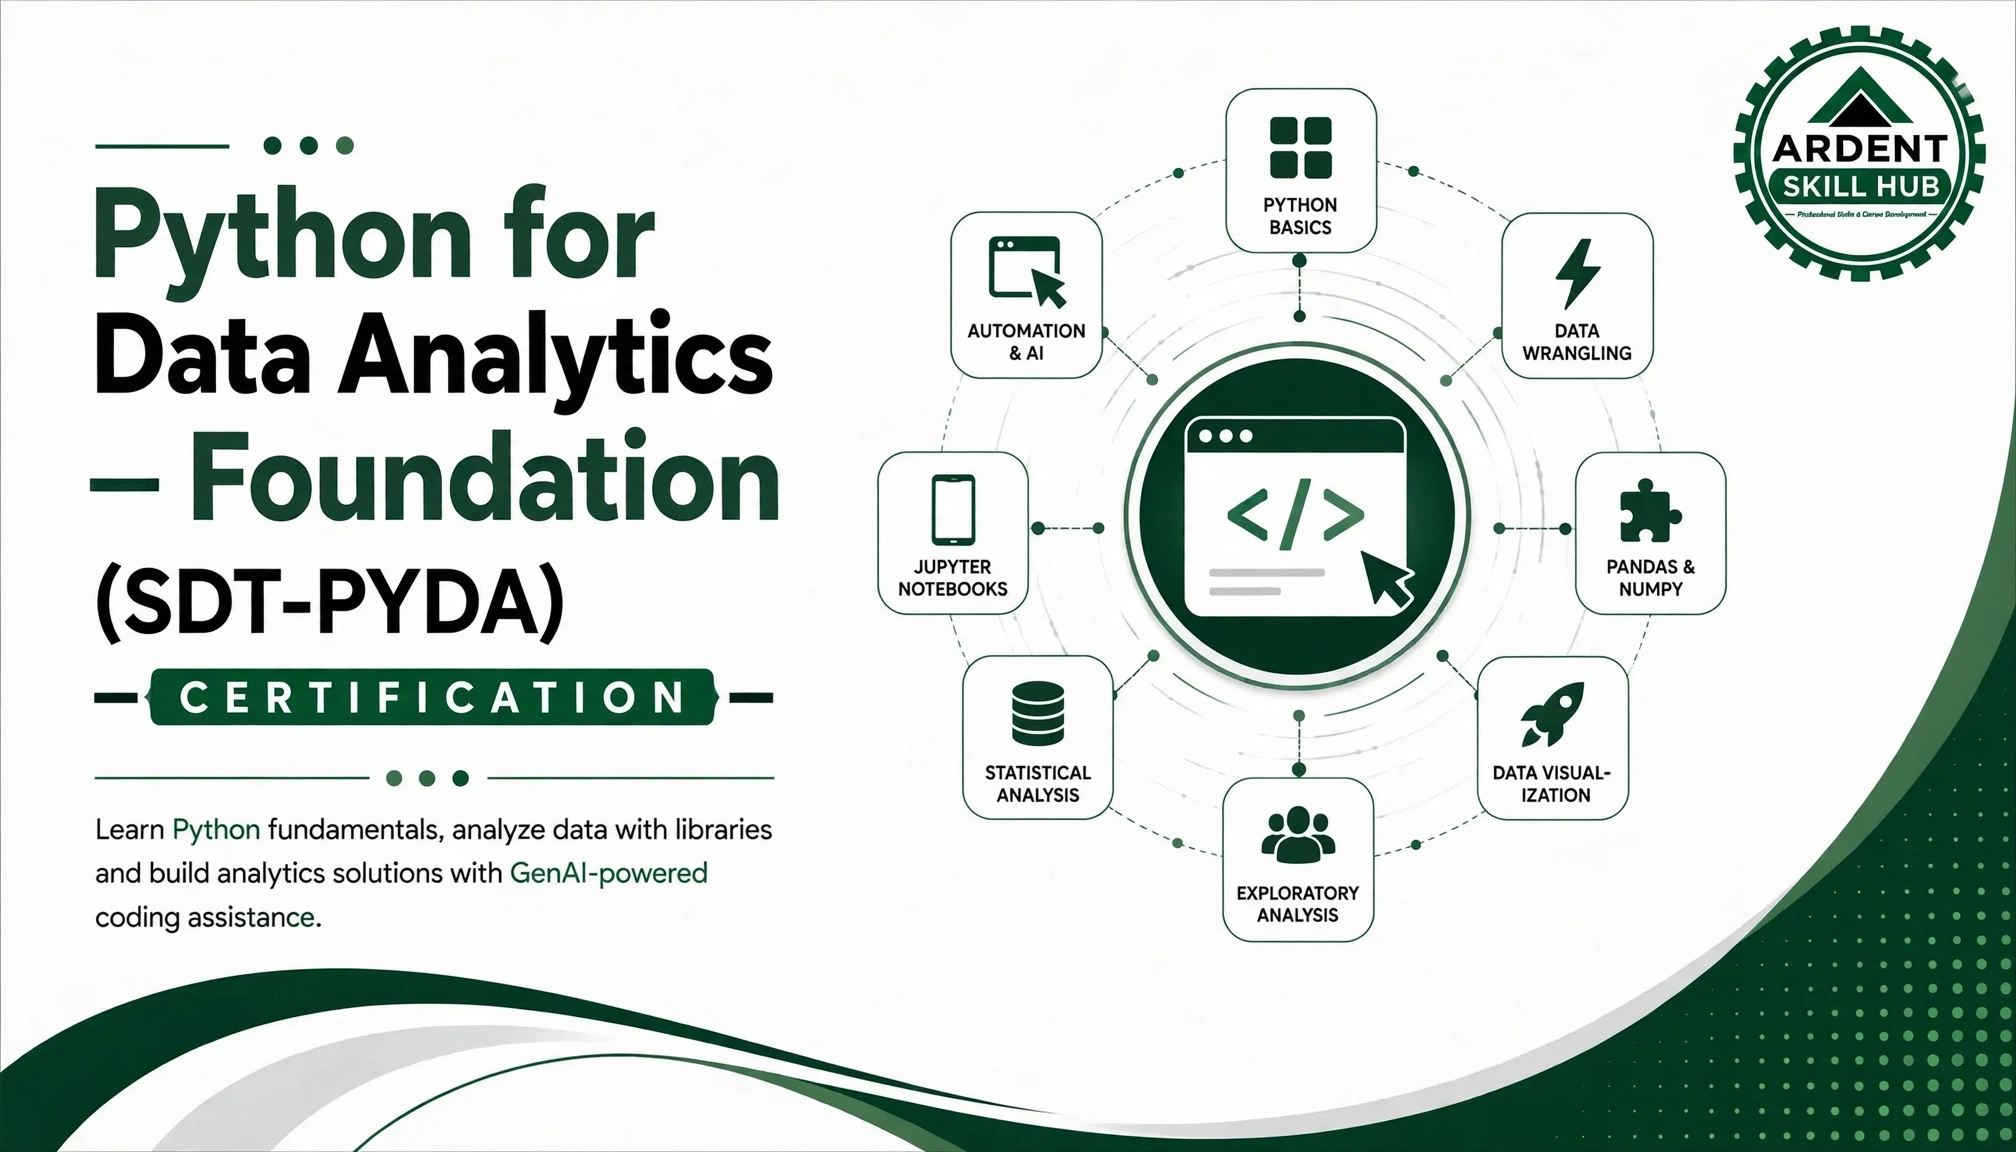
Ardent Certified-Python for Data Analytics & Data Science (PYDA)
Start your journey into Data Science and Machine Learning with Python. Learn programming fundamentals, data analysis, and visualization through hands-on practice—no prior coding experience required.
₹45,000
₹22,500
Save ₹22,500
6 Months
Duration
Live +
Recorded
Max 30
Students
Govt.
Certified




Empowering learners with AI skills
to build a smarter tomorrow.
to build a smarter tomorrow.
Learning Outcomes
- Write basic Python programs using variables, functions, and control flow
- Clean and analyse real-world datasets using Pandas
- Produce clear data visualisations and a written analysis summary
- Perform data cleaning and preprocessing to improve data quality.
- Conduct Exploratory Data Analysis (EDA) to identify trends and patterns.
- Create professional charts and visualizations using Matplotlib and Seaborn.
- Apply basic statistical techniques to interpret and summarize data.
- 8. Identify meaningful business insights and relationships within datasets.
- 9. Apply introductory Machine Learning techniques to practical datasets.
- 10. Complete end-to-end data analysis projects using industry-relevant Python tools.
Course Objectives
- 1. Build foundational Python programming skills with no prior coding background required
- 2. Develop practical ability to clean, explore, and visualise data using Python
- 3. Prepare students for progression into the Data Science & Machine Learning track
- 4. Develop practical data manipulation skills using Pandas.
- 5. Learn to clean, transform, and prepare datasets for analysis.
- 6. Develop effective data visualization skills using Matplotlib and Seaborn.
- 7. Understand basic statistics and exploratory data analysis (EDA) techniques.
- 8. Introduce learners to Machine Learning concepts and data-driven prediction.
- 9. Develop the ability to work with real-world datasets and solve analytical problems.
- 10. Build practical project experience to prepare learners for Data Analytics and Data Science careers.
Applications in Industry
- Entry point into data analyst and junior programming roles
- Foundation for further study in data science, ML, or software development
- Independent data analysis for academic or personal projects
- Financial Data Analysis – Work with financial datasets for reporting, trend analysis, and forecasting.
- Customer Analytics – Understand customer behavior, preferences, and purchasing patterns.
- Healthcare Analytics – Analyze healthcare datasets to discover patterns and meaningful insights.
- Operations Analytics – Use data to identify inefficiencies and improve operational performance.
- Reporting & Visualization – Transform raw datasets into understandable reports and visual insights.
- Predictive Analytics – Use introductory Machine Learning techniques to support prediction-based analysis.
- Data-Driven Decision Making – Support organizations in making informed decisions using analytical insights.
Frequently Asked Questions
It is a practical, career-focused program that teaches learners how to use Python for data analysis, visualization, statistical exploration, and introductory Data Science.
The course is suitable for students, graduates, freshers, working professionals, and beginners interested in Data Analytics or Data Science.
No. The course starts with Python fundamentals and gradually progresses toward data analysis and Data Science applications.
The course focuses on popular libraries including NumPy, Pandas, Matplotlib, Seaborn, and Scikit-learn.
Yes. Learners will practice handling missing data, transforming datasets, encoding data, and preparing data for analysis and modeling.
EDA is the process of examining and analyzing datasets to discover patterns, relationships, trends, and anomalies before further analysis or Machine Learning.
Yes. Learners will create meaningful visualizations using Matplotlib and Seaborn to communicate data insights effectively.
Yes. The program introduces essential Machine Learning concepts and techniques, providing a foundation for further study in Data Science and AI.
Yes. Learners work with real-world datasets and practical exercises/projects to apply the concepts learned throughout the program.
The skills can help learners prepare for roles such as Data Analyst, Junior Data Analyst, Data Science Intern, Reporting Analyst, Business Analyst, and Data Science Associate.
Course Content — Modules
1
Module 1: Python Fundamentals & the Data Science Landscape
1
The Data Analyst & Data Scientist Toolkit: Where Python Fits
2
Setting Up Your Python Environment: Jupyter, Anaconda & VS Code
3
Hands-on Lab: Writing & Running Your First Python Analysis Script
2
Module 2: Python Programming Basics: Variables, Data Types & Control Flow
1
Variables, Data Types & Operators
2
Conditional Logic & Loops for Data Processing
3
Hands-on Lab: Automating a Simple Business Calculation
3
Module 3: Functions, Modules & Error Handling in Python
1
Writing Reusable Functions for Analysis Workflows
2
Importing Modules, Packages & the Python Standard Library
3
Hands-on Lab: Building a Reusable Data Validation Function
4
Module 4: Data Structures: Lists, Dictionaries, Tuples & Sets
1
Lists & Tuples for Sequential Data
2
Dictionaries & Sets for Lookups & Grouping
3
Hands-on Lab: Structuring Raw Sales Records with Python Collections
5
Module 5: Working with Files & Data Formats (CSV, JSON, Excel)
1
Reading & Writing CSV, Excel & Text Files
2
Working with JSON & Semi-Structured Data
3
Hands-on Lab: Building a Multi-Format Data Ingestion Script
6
Module 6: NumPy for Numerical Computing
1
NumPy Arrays: Creation, Indexing & Slicing
2
Vectorized Operations & Broadcasting
3
Hands-on Lab: Performing Fast Numerical Analysis on a Business Dataset
7
Module 7: Pandas Fundamentals: Series & DataFrames
1
Introduction to Series & DataFrames
2
Indexing, Selecting & Filtering Data
3
Hands-on Lab: Loading & Exploring a Sales Dataset in Pandas
8
Module 8: Data Cleaning & Preparation with Pandas
1
Handling Missing Values & Duplicates
2
Data Type Conversion & Standardization
3
Hands-on Lab: Cleaning a Messy Customer Dataset
9
Module 9: Data Wrangling: Merging, Joining & Reshaping Data
1
Merging, Joining & Concatenating DataFrames
2
Grouping, Pivoting & Reshaping Data
3
Hands-on Lab: Building a Consolidated Sales & Customer Dataset
10
Module 10: Exploratory Data Analysis (EDA) with Python
1
EDA Workflow & Techniques
2
Summary Statistics & Identifying Patterns
3
Hands-on Lab: Performing EDA on a Business Performance Dataset
11
Module 11: Data Visualization with Matplotlib
1
Matplotlib Basics: Plots, Labels & Styling
2
Line, Bar, Histogram & Scatter Plots
3
Hands-on Lab: Visualizing Sales Trends with Matplotlib
12
Module 12: Advanced Visualization with Seaborn & Plotly
1
Statistical Visualization with Seaborn
2
Interactive Visualizations with Plotly
3
Hands-on Lab: Building an Interactive Business Dashboard
13
Module 13: Working with Databases: SQL & Python Integration
1
Connecting Python to SQL Databases
2
Querying & Loading Data with SQLAlchemy & Pandas
3
Hands-on Lab: Extracting & Analyzing Data from a SQL Database
14
Module 14: Web Scraping & API Data Collection
1
Web Scraping Basics with BeautifulSoup
2
Collecting Data from REST APIs
3
Hands-on Lab: Building a Data Collection Pipeline from an API
15
Module 15: Statistics for Data Analysis with Python
1
Descriptive Statistics & Distributions
2
Correlation & Hypothesis Testing Basics
3
Hands-on Lab: Statistical Analysis of a Business Dataset
16
Module 16: Probability & Statistical Inference
1
Probability Concepts for Data Science
2
Confidence Intervals & Hypothesis Testing
3
Hands-on Lab: A/B Testing Analysis with Python
17
Module 17: Introduction to Machine Learning with Scikit-learn
1
Machine Learning Concepts & Workflow
2
The Scikit-learn API: Fit, Predict & Transform
3
Hands-on Lab: Building Your First ML Model
18
Module 18: Supervised Learning: Regression Models
1
Linear & Multiple Regression
2
Regularization: Ridge & Lasso Regression
3
Hands-on Lab: Predicting Sales Revenue with Regression
19
Module 19: Supervised Learning: Classification Models
1
Logistic Regression & Decision Trees
2
Random Forests & Ensemble Methods
3
Hands-on Lab: Predicting Customer Churn
20
Module 20: Unsupervised Learning: Clustering & Dimensionality Reduction
1
K-Means & Hierarchical Clustering
2
Dimensionality Reduction with PCA
3
Hands-on Lab: Customer Segmentation Analysis
21
Module 21: Model Evaluation, Tuning & Cross-Validation
1
Evaluation Metrics for Regression & Classification
2
Cross-Validation & Hyperparameter Tuning
3
Hands-on Lab: Optimizing a Predictive Model
22
Module 22: Time Series Analysis with Python
1
Time Series Data Handling & Decomposition
2
Forecasting with ARIMA & Prophet
3
Hands-on Lab: Forecasting Demand & Revenue Trends
23
Module 23: Introduction to Deep Learning & AI-Assisted Analytics
1
Neural Network Fundamentals & TensorFlow/Keras Basics
2
AI-Assisted Analytics: Automating Insights with Python & LLMs
3
Hands-on Lab: Building a Simple Neural Network Model
24
Module 24: Capstone Project: End-to-End Data Science Case Study & Certification
1
Capstone Brief: Full Data Science Project Lifecycle
2
Hands-on Lab: Building the End-to-End Solution, from EDA to ML Model
3
Final Presentation & PYDA Certification Review
 50% OFF
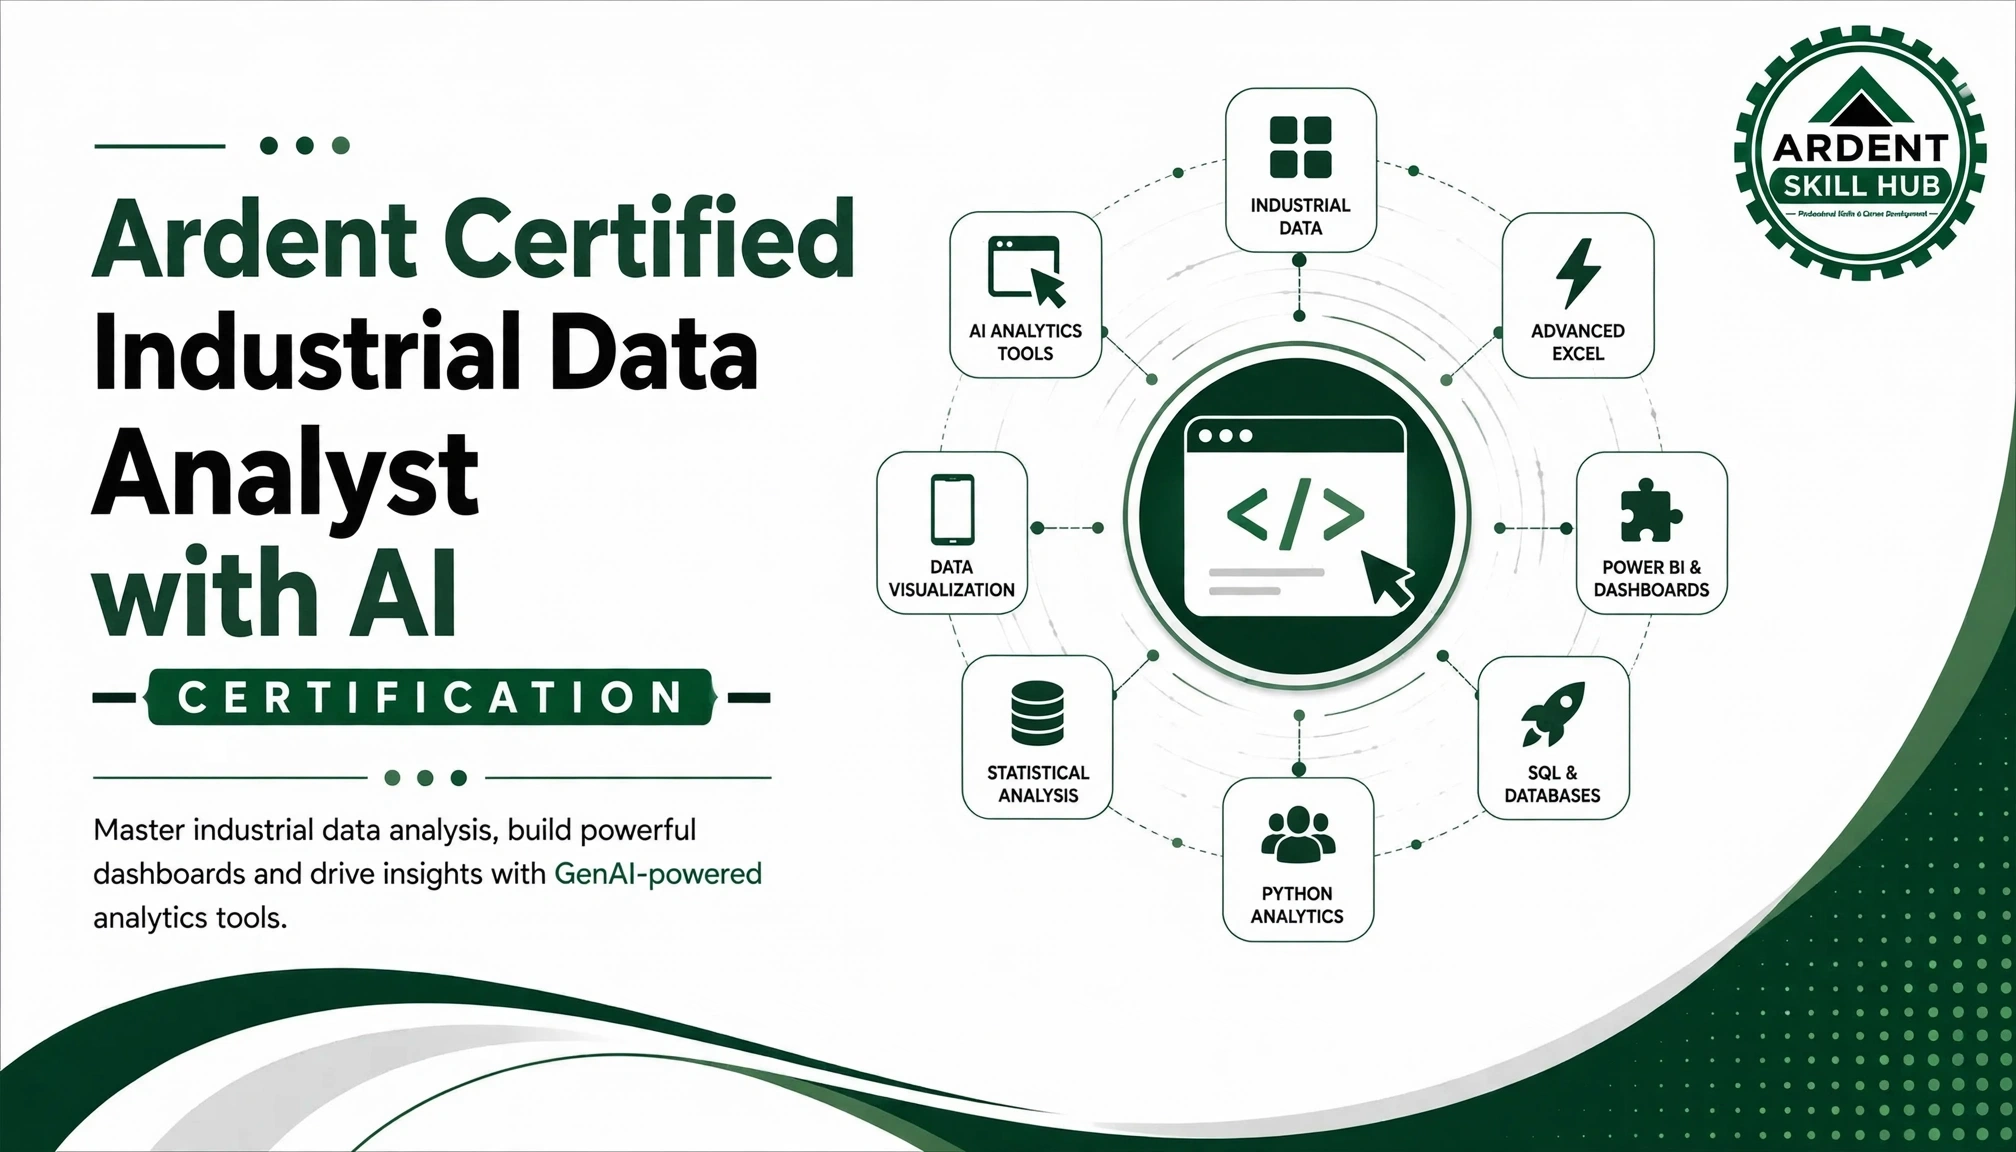
Ardent Certified AI-Powered Industrial Data Analyst — Advanced Excel, Power BI & Tableau (AIDA)
₹45,000
₹22,500
Save ₹22,500
 50% OFF
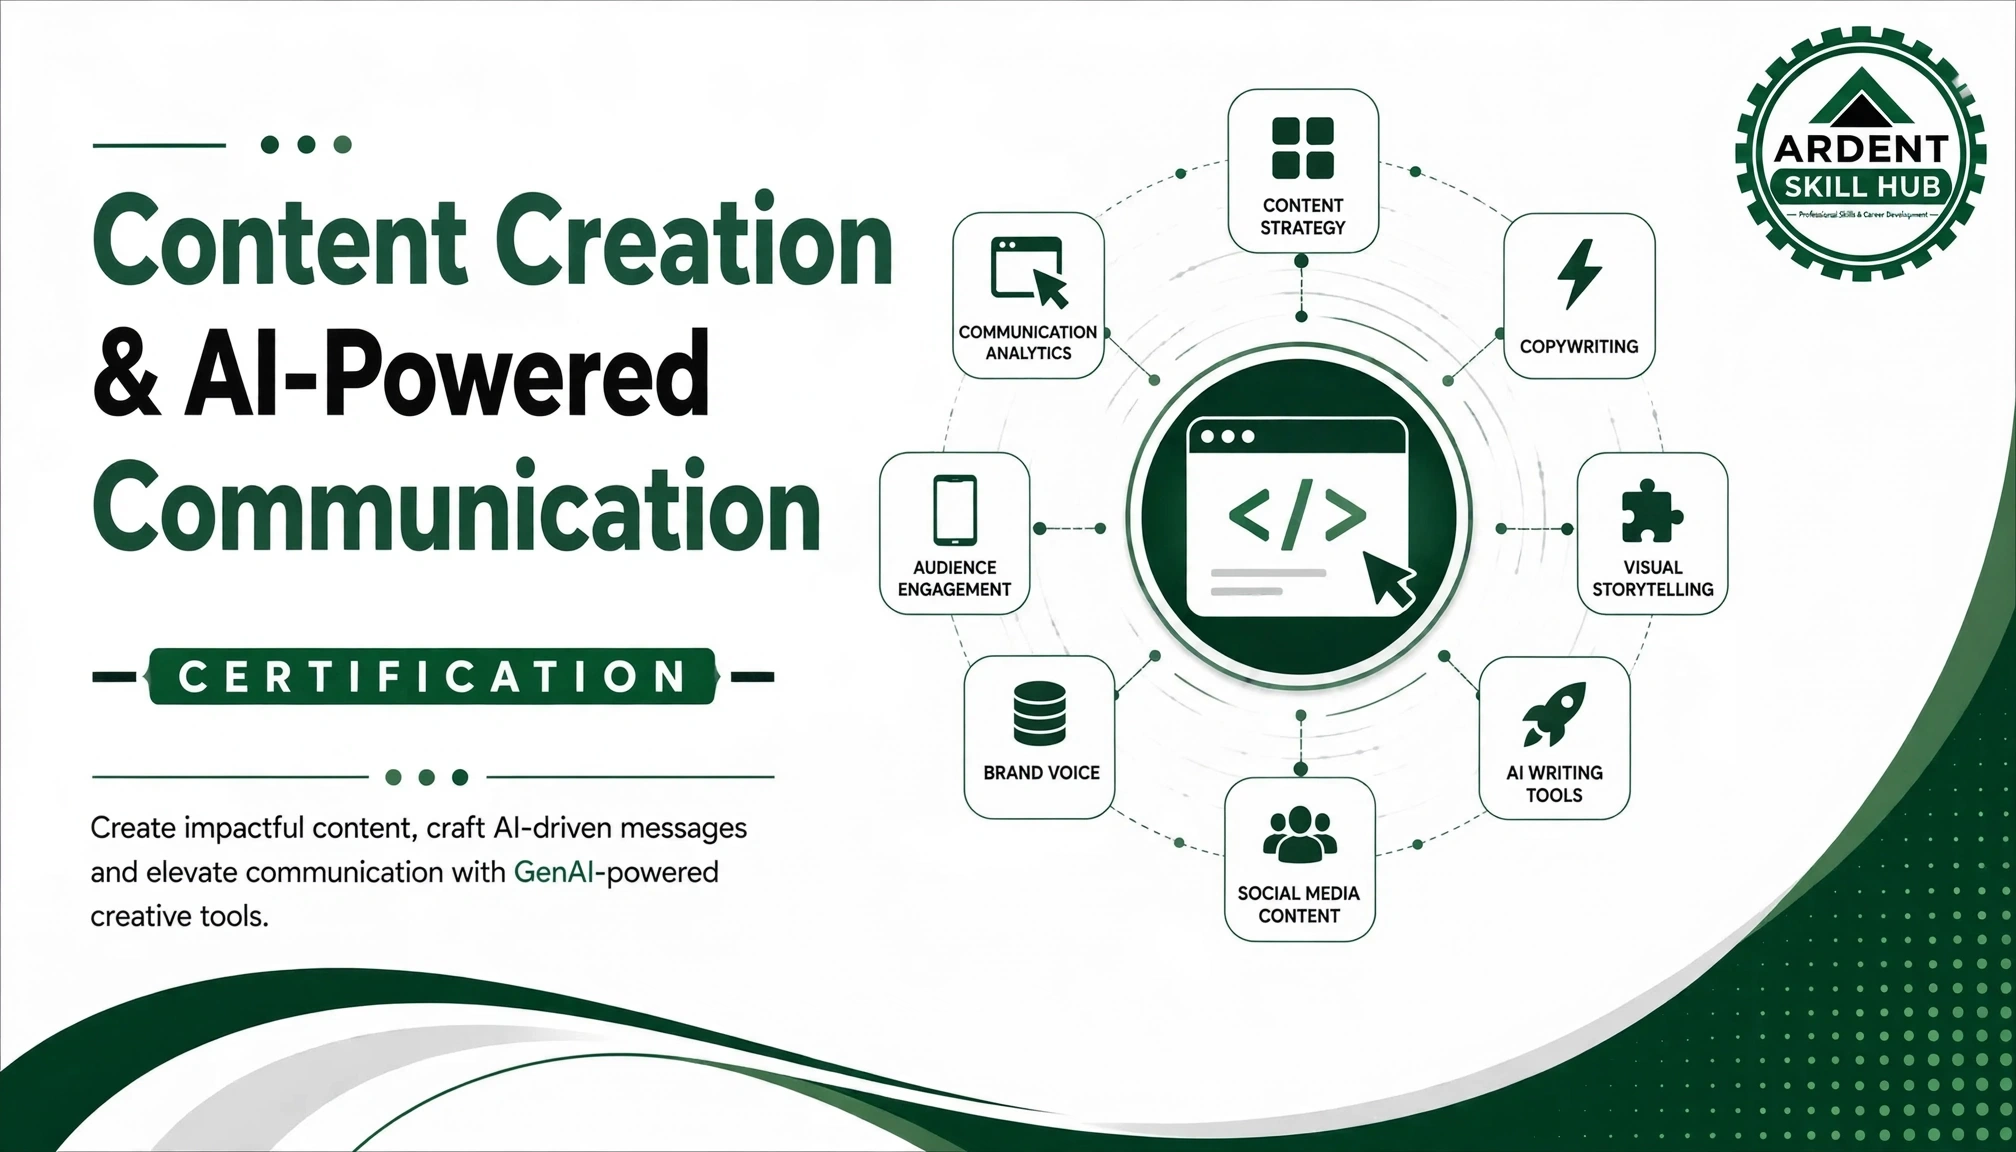
Ardent Certified-AI-Powered Content Creation, Communication & Office Automation (AICO)
₹52,000
₹26,000
Save ₹26,000
 50% OFF
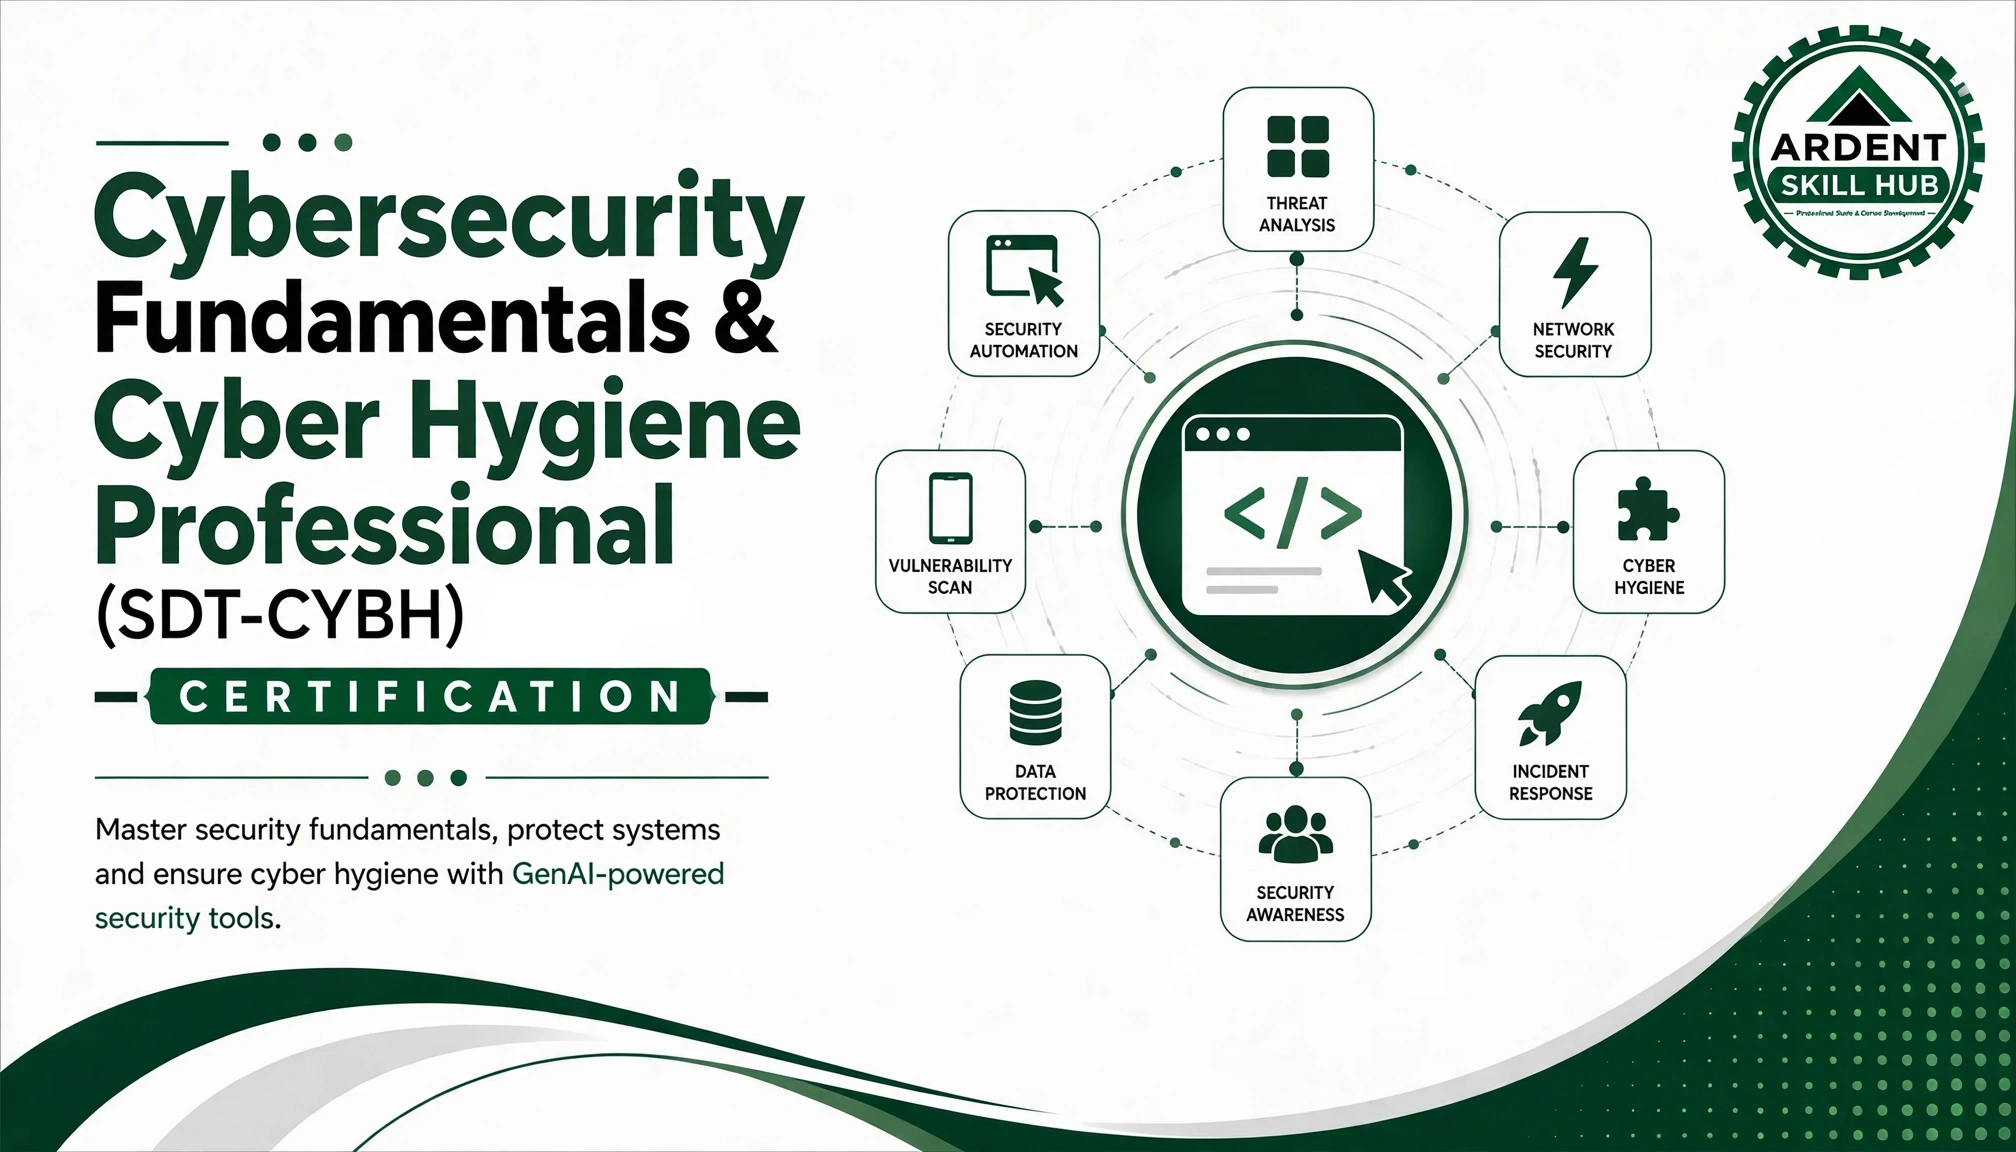
Ardent Certified-CyberShield-Digital Security & Cyber Hygiene (CYBH)
₹45,000
₹22,500
Save ₹22,500
Course Delivery Format
Duration6 months (100 hours total)
ModeOnline Live Classes + Recorded Lectures
ScheduleWeekend & Weekday Evening Batches
Batch SizeMaximum 30 students
Prerequisites
- Laptop/Desktop with stable internet connection
- Basic English proficiency
- Willingness to dedicate 4–5 hours weekly
- No prior technical knowledge required
Investment & Scholarships
Course Fee
₹45,000
₹22,500
EMI OptionsAvailable
ScholarshipsMerit-based & Need-based
Early Bird15% Discount
Certification
- Course Completion Certificate
- Industry-recognized certifications
- LinkedIn badge
- Project completion certificates
Placement Support
- Resume building & LinkedIn optimization
- Mock interviews & soft skills training
- Access to job portal with 200+ partners
- Networking sessions with industry professionals
- Lifetime placement assistance
Learning Support
- 24/7 access to recorded lectures
- Doubt clearing sessions twice weekly
- Dedicated mentor support
- Peer learning community
- Monthly industry expert guest lectures